Reporting Tools Offered Within Dynamics 365 Enterprise
Excel Integration is Now a Two Way StreetMicrosoft has enhanced the Excel integration feature in Dynamics 365 Enterprise. It’s available in more places and it is very easy to use. Users can now use the ‘Open in Excel’ function which is available on many forms. This will generate the excel template together with the add-in. This template helps the user to edit, insert, and possibly delete the records using Excel.
Embedded Analytics/Power BI
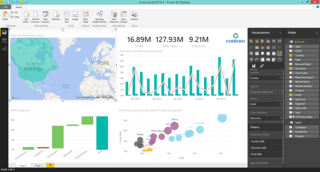
Dynamics 365 comes with a number of rich work spaces with embedded Power BI Reports. By using rich infographics and visuals supported by Power BI, work spaces can provide a highly-visual yet interactive experience for the user. Using infographics helps users can get a quick glance of the state of the business. They can interact with data by simply clicking or touching visuals on the page. Users can see the cause and effect, perform simple what-if operations without leaving the work space. Thanks to stunning yet interactive visuals, users will have fun exploring data and discovering hidden trends. Power BI licenses are not required to access these reports, which are embedded in the Dynamics 365 application. If a user requires access to Power BI reports and functionality outside of this embedded experience, a Power BI license must be obtained separately. New Power BI reports created can then be added to Dynamics 365 work spaces. Most companies start with the embedded reports and then add new reports if needed.
- Actual vs budget Power BI content
- Benefits Power BI content
- Cash overview Power BI content
- CFO overview Power BI content
- Compensation Power BI content
- Cost accounting analysis Power BI content
- Credit and collections management Power BI content
- Employee development Power BI content
- Financial insights Power BI content
- Financial performance Power BI content
- Fixed asset management Power BI content
- Learning Power BI content
- Practice manager Power BI content
- Production performance Power BI content
- Purchase spend analysis Power BI content
- Recruiting Power BI content
- Sales and profitability performance Power BI content
- Vendor payments Power BI content
- Warehouse performance Power BI content
- Workforce metrics Power BI content
Financial Reports
Formerly FRx, Management Reporter is a tool that only an accountant will love - and of course any board member, president, CEO, CFO, or other business leader. This tool gets down to the true performance of business by utilizing General Ledger (GL) data with a drill down into the details if needed and security access is allowed. Sub ledger data should be clean and correct by the time it hits the GL which is why Management Reporter uses this data to create and format boardroom type reports. Management Reporter can also be used for accountants to review and verify that GL data balances and anomalies can be easily researched with the drill down feature.
- Format your report to contain line numbers to easily identify report rows and statutory formats.
- Choose the financial reporting financial dimensions and attributes that you want in the General ledger. This prevents unnecessary information from showing on your report if it is not critical to financial reporting.
- Print read-only, presentation ready financial reports to PDF
- View additional details and versions of the financial reports with the report list enhancements. The list of reports shows when the report was last generated and how it was modified by. You can also quickly filter your report list by a folder name so you only see the reports relevant to you. View previous versions of the report to accurately track the change in data over time.
- View translated financial data, by any currency in the system, simply by choosing the currency in the report.
- Make it easy for users to see the generated date and time on report headers or footers on a financial report by adding the new auto text options. Knowing when a report was generated provides crucial information to a user on how new the report data is.
- Analyze data more efficiently with financial dimensions in separate columns when exporting to Microsoft Excel.
- There are a total of 22 predefined reports available out of the box. These will need to be modified to meet your COA and of course you can create your own reports. Clients First can train your users or create the reports for you.
Default Financial Reports
SSRS or SQL Reporting Services
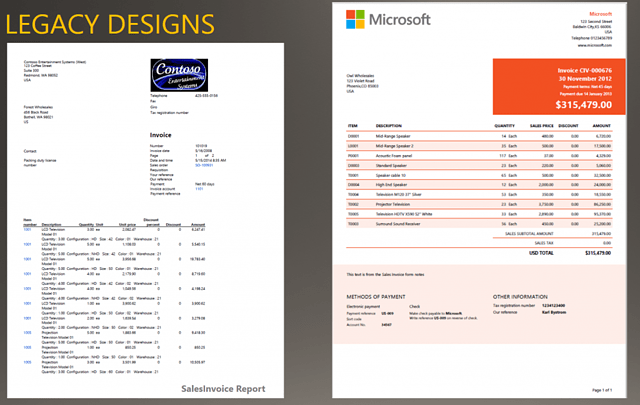
A new set of developer tools is available that takes the form of report designs for several core business documents in the application suite. These report designs have been re-imagined so that flexible branding appears in the header and footer of public-facing documents when transactions are generated in Dynamics 365 Enterprise. The following illustration shows how an earlier design for a sales invoice differs from a modern sales invoice design.

Watch the Dynamics 365 Reporting and Power BI Video (2018)
Contact Clients First if you have any questions: 800.331.8382 x108. Clients First is a Gold Dynamics ERP and CSP Partner with Dynamics AX and 365 Enterprise experience in manufacturing, supply chain, projects and finance.
 Dynamics 365 Reporting and Power BI Video">